Revenue First: Rethinking the Metrics That Matter
The easiest metrics to measure are not always the most meaningful
When evaluating asset management marketing programs, indicators such as response / registration rate, open / click-through rate may be among the metrics you look for.
In an example of a narrower view, search marketing providers are measuring clicks, page visitation and navigation, length of visit, and the value of a “lead” based on what you paid for it.
Metrics are useful when they’re used for the tasks they’re best suited for, such as:
- Testing which message/content combinations are working best,
- Reviewing the types of content that prospects find most appealing,
- Understanding where a prospect started in buyer journey and how they progressed through each stage to become a new advisor client (organic search, PPC, display ads, site sponsorship, social media, etc.)
These data are important but meaningless in the context of stand-alone metrics, without additional context for what happens next. They are irrelevant if you’re not engaging your ideal accounts or prospective buyers. You may consider them as leading indicators.
How do you re-think metrics, differentiate the best metrics that matter?
Differentiating between individual metrics and the KPIs that Matter.
Consider a revenue-first approach to re-think the metrics that matter, that is, metrics that are predictors of qualified account or sales opportunities and ultimately revenue delivered.
- Start by defining KPIs or Key Performance indicators, that is, measurable values that show the progress of your business goals for your Asset Management Marketing and Sales
- Gain a clear understanding of the importance of the KPIs, their hierarchy and how to align efforts to maximize performance in each.
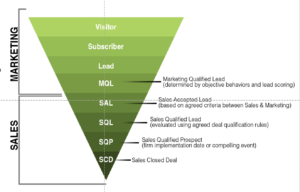
 See illustrative metrics, listed hierarchically from most important to least important
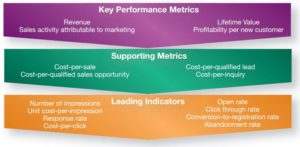
- Key Performance Indicators (KPIs)
- Supporting Metrics
- Supporting Metrics
Sales Activity Attributable to Marketing.
One of the key challenges is calculating sales activity attributable to marketing. The Supporting Metrics, e.g., cost-per-sale, cost-per-qualified-lead are often much easier to track and report on than the core KPIs – e.g., sales activity attributable to marketing.
While new software tools are helping to bridge the gap, there’s still a bit of “black magic” to the matter. Let’s consider a this scenario for sales attributable to marketing:
You’ve targeted a prospect through multiple media. What activity do you “credit” for the inquiry if they’ve responded to a direct message via LinkedIn or an e-mail campaign, enter a landing page through paid search, or click on a link in social media—? After all, it may have been the display ad or landing page that did the bulk of the selling, even if the response/registration initialy came through via e-mail. Last click attribution can be quite misleading at times. This suggests the need to measure return-on-marketing spend by (i) individual activity AND (iI) in the aggregate.
In the end, attribution will be an important thing to solve for in establishing a revenue first hierarchy predictors of qualified account or sales opportunities and ultimately revenue delivered.
Next Up: Activate your metrics to track advisors through the revenue producing process.
Note: the author of this post is indebted to the work of Keith Sullivan in his comprehensive guidebook, “Exposed: The False Promises of Revenue Marketing” and the deep insights he provides into the 9 principles of buyer engagement.